Relative Performance is a powerful tool for finding market leaders in any trading conditions. Here are three ETFs heading into 2021 strong.
“It’s all relative” is a common expression which is often used to dismiss something. Yet when it comes to the stock market, relativity can be an investor’s best friend.
One of the most important skills a trader can learn is relative performance analysis. Relative performance (or relative strength) is a measure of how an individual stock is acting in relation to the overall broad market.
If a stock is rising, it can exhibit poor relative strength when compared with the rest of the market. For instance, if the broad stock market has advanced 10% in a period of months while an individual stock has only gone up 5%, the stock is underperforming the broad market on a relative basis.
Cabot’s momentum investing expert Mike Cintolo recently wrote a useful article about relative performance. He observed:
“A stock that holds its value during a declining market often soars once the market turns higher. In a strong bull market, most stocks will rise, even the stocks of weak companies! But you should concentrate your efforts on the best companies with the strongest stocks, the market’s leaders. The way to find them is by analyzing RP lines.”
[text_ad]
The RP line technique mentioned above was developed many years ago by Carlton Lutts, founder of our Cabot Top Ten Trader momentum-investing advisory. He wrote:
“Relative performance (RP) is simply a measurement of how a stock is acting relative to the market as a whole. This can be measured mathematically, but we prefer a visual representation because we have found it easier to analyze. As they say, a picture is worth a thousand words.”
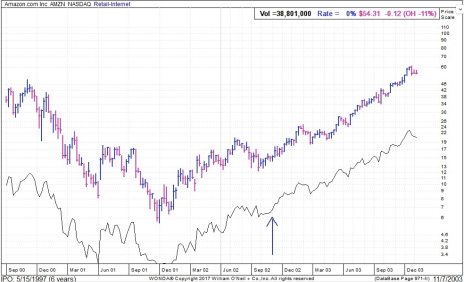
An example of relative performance is shown here, which compares the price performance of Amazon’s (AMZN) stock price with its RP line.
An RP line is basically the stock’s (or ETF’s) daily closing price divided by the daily closing price of the benchmark S&P 500 Index or another major index. It shows how the stock is behaving compared to the broad market. A stock or ETF that is persistently outperforming the S&P 500 Index is likely to continue doing so in the foreseeable future, so a persistently rising RP line is one of the first things you should look for when evaluating a stock for a short-term investment.
In his book, Technical Analysis Explained, Martin Pring writes, “When a stock and its RP are both rising and it appears that the RP trend is about to reverse, a warning is given of a possible change in the trend of the price itself. This is because RP typically peaks ahead of price. On the other hand, a firming of the RP line during a declining trend indicates a position of growing technical strength.” Pring advises that since the lead time given by such signals varies, it’s important to await a confirmation by a similar trend reversal in the stock’s price itself.
Clearly then, knowing which stocks are in a relative strength position versus the broad stock market can be a valuable tool for increasing your investment returns. More importantly, this tool will allow you to follow in the footsteps of the Wall Street pros and will give you a considerable advantage over the average investor.
With this in mind, let’s apply this powerful technique to some S&P sectors to see which ones are in a position of strength versus the S&P 500 Index heading into 2021. What follows is a ranking of the top three sector ETFs by relative performance rank.
Sector ETF #1
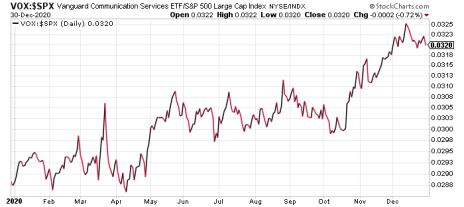
The communication services sector was white hot in 2020, with companies that provided integrated circuits, software and other services for use in wireless communications outperforming for much of the year. That strong forward momentum is likely to continue into 2021, however, since the work-from-home paradigm is only expected to expand.
A testimony to the powerful relative performance of this sector can be seen below, which shows the RP line for the Vanguard Communication Services ETF (VOX). As long as the RP line maintains its rising trend, investors are justified maintaining some exposure to this sector in the new year.
Sector ETF #2
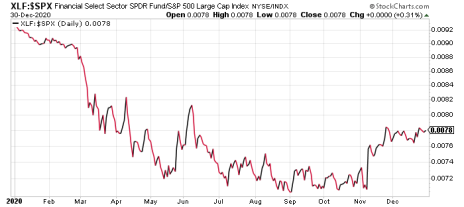
Bank stocks took a beating in 2020 and lagged the post-crash recovery for most of the year. But the Federal Reserve recently lifted the suspension on share buybacks for U.S. banks for Q1 2021, giving financial sector stocks a much-needed lift heading into the new year.
On that note, there is value to be found in the bank stocks (many of which are still well below last year’s price highs and trading at attractive multiples). This is illustrated by the RP line for the Financial Select Sector SPDR Fund (XLF), which is a good proxy for the banks.
Sector ETF #3
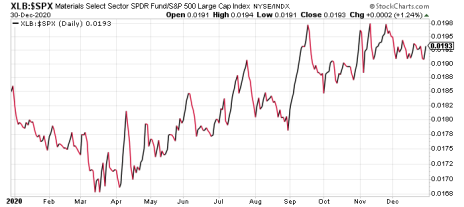
Basic materials stocks are also in good shape heading into 2021 and should receive a boost from a weaker U.S. dollar in the coming months. The companies that mine and manufacture metals, chemicals, papers and plastics are essential and are less likely to be impacted by economic headwinds. You might therefore want to consider owning the Materials Select Sector SPDR Fund (XLB), which sports an attractive relative performance line as can be seen here.
If you want the best performing growth stocks right now, I highly recommend subscribing to our Cabot Top Ten Trader advisory, where chief analyst Mike Cintolo utilizes relative performance to provide you with some of the market’s strongest growth stocks from both a technical and a fundamental perspective.
To learn more, click here
[author_ad use_post="125410"]
